pykp.knapsack.Knapsack.
plot_terminal_node_hist#
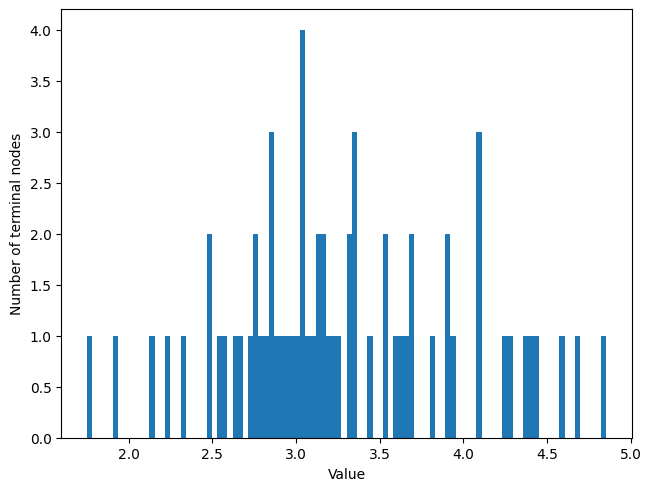
- Knapsack.plot_terminal_node_hist(ax: Axes = None) tuple[Figure, Axes]#
Plot a histogram of terminal node values.
All nodes are enumerated to find terminal nodes, and then plotted as a histogram. Terminal nodes are arrangements of items that are under the weight constraint, and at full capacity––that is, no more items can be added without exceeding the capacity constraint. Terminal nodes are a subset of
feasible_nodes.If the terminal nodes have not been enumerated, this method will first call solve with the brute_force method to find the terminal nodes. Note that this is infeasible for large n.
- Parameters:
- axmatplotlib.pyplot.Axes, optional
The axes object to plot the histogram. Defaults to None.
- Returns:
- tuple of (matplotlib.pyplot.Figure, matplotlib.pyplot.Axes)
The figure and axes objects of the resulting histogram.
Examples
>>> from pykp.knapsack import Sampler
>>> import matplotlib.pyplot as plt
>>>
>>> sampler = Sampler(num_items=10, normalised_capacity=0.6)
>>> sample = sampler.sample(seed=42)
>>> fig, ax = sample.plot_terminal_nodes_histogram()
>>> plt.show()