pykp.knapsack.Knapsack.
plot_graph#
- Knapsack.plot_graph(ax: Axes = None, colour_map: dict = None, show_legend: bool = True) tuple[Figure, Axes]#
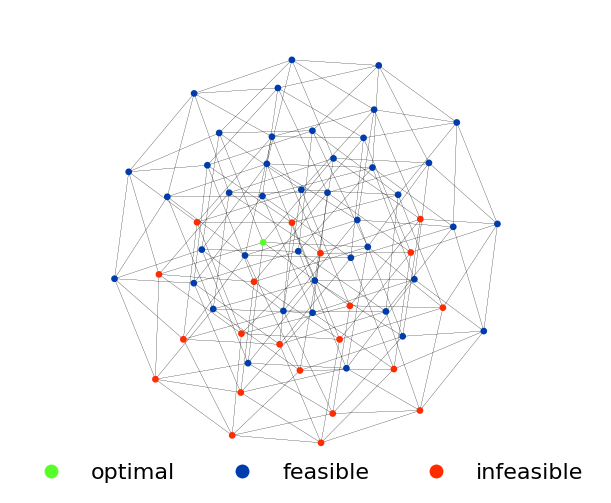
Visualises a graph representation of the knapsack problem.
Each node in the graph represents a unqiue arrangement of items inside the knapsack. Edges connect nodes whose states differ by a single item, and represent the elementary operations of adding or removing a single item from the knapsack.
- Parameters:
- axmatplotlib.pyplot.Axes, optional
An existing axes object to plot on. Defaults to None.
- Returns:
- tuple of (matplotlib.pyplot.Figure, matplotlib.pyplot.Axes)
The figure and axes of the created or updated plot.
- Other Parameters:
- colour_mapdict, optional
A dictionary mapping node types to colours. A valid colour map must contain keys “optimal”, “feasible”, and “infeasible”. Default is None.
- show_legendbool, optional
Whether to display a legend on the plot. Default is True.
Examples
>>> from pykp.knapsack import Sampler
>>> import matplotlib.pyplot as plt
>>>
>>> sampler = Sampler(num_items=6, normalised_capacity=0.6)
>>> sample = sampler.sample(seed=42)
>>> fig, ax = sample.plot_graph()
>>> plt.show()